PLATASPIDIDAE Dallas, 1851
|
publication ID |
https://doi.org/10.1111/j.1096-0031.2008.00224.x |
|
DOI |
https://doi.org/10.5281/zenodo.4334432 |
|
persistent identifier |
https://treatment.plazi.org/id/03E187AB-6B75-FFF1-FF3E-FA5E15194AEC |
|
treatment provided by |
Valdenar |
|
scientific name |
PLATASPIDIDAE Dallas |
| status |
|
Historical: Dallas (1851) was the first worker to recognize this Old World taxon at the family-group level. Stål (1864) treated it as a subfamily of
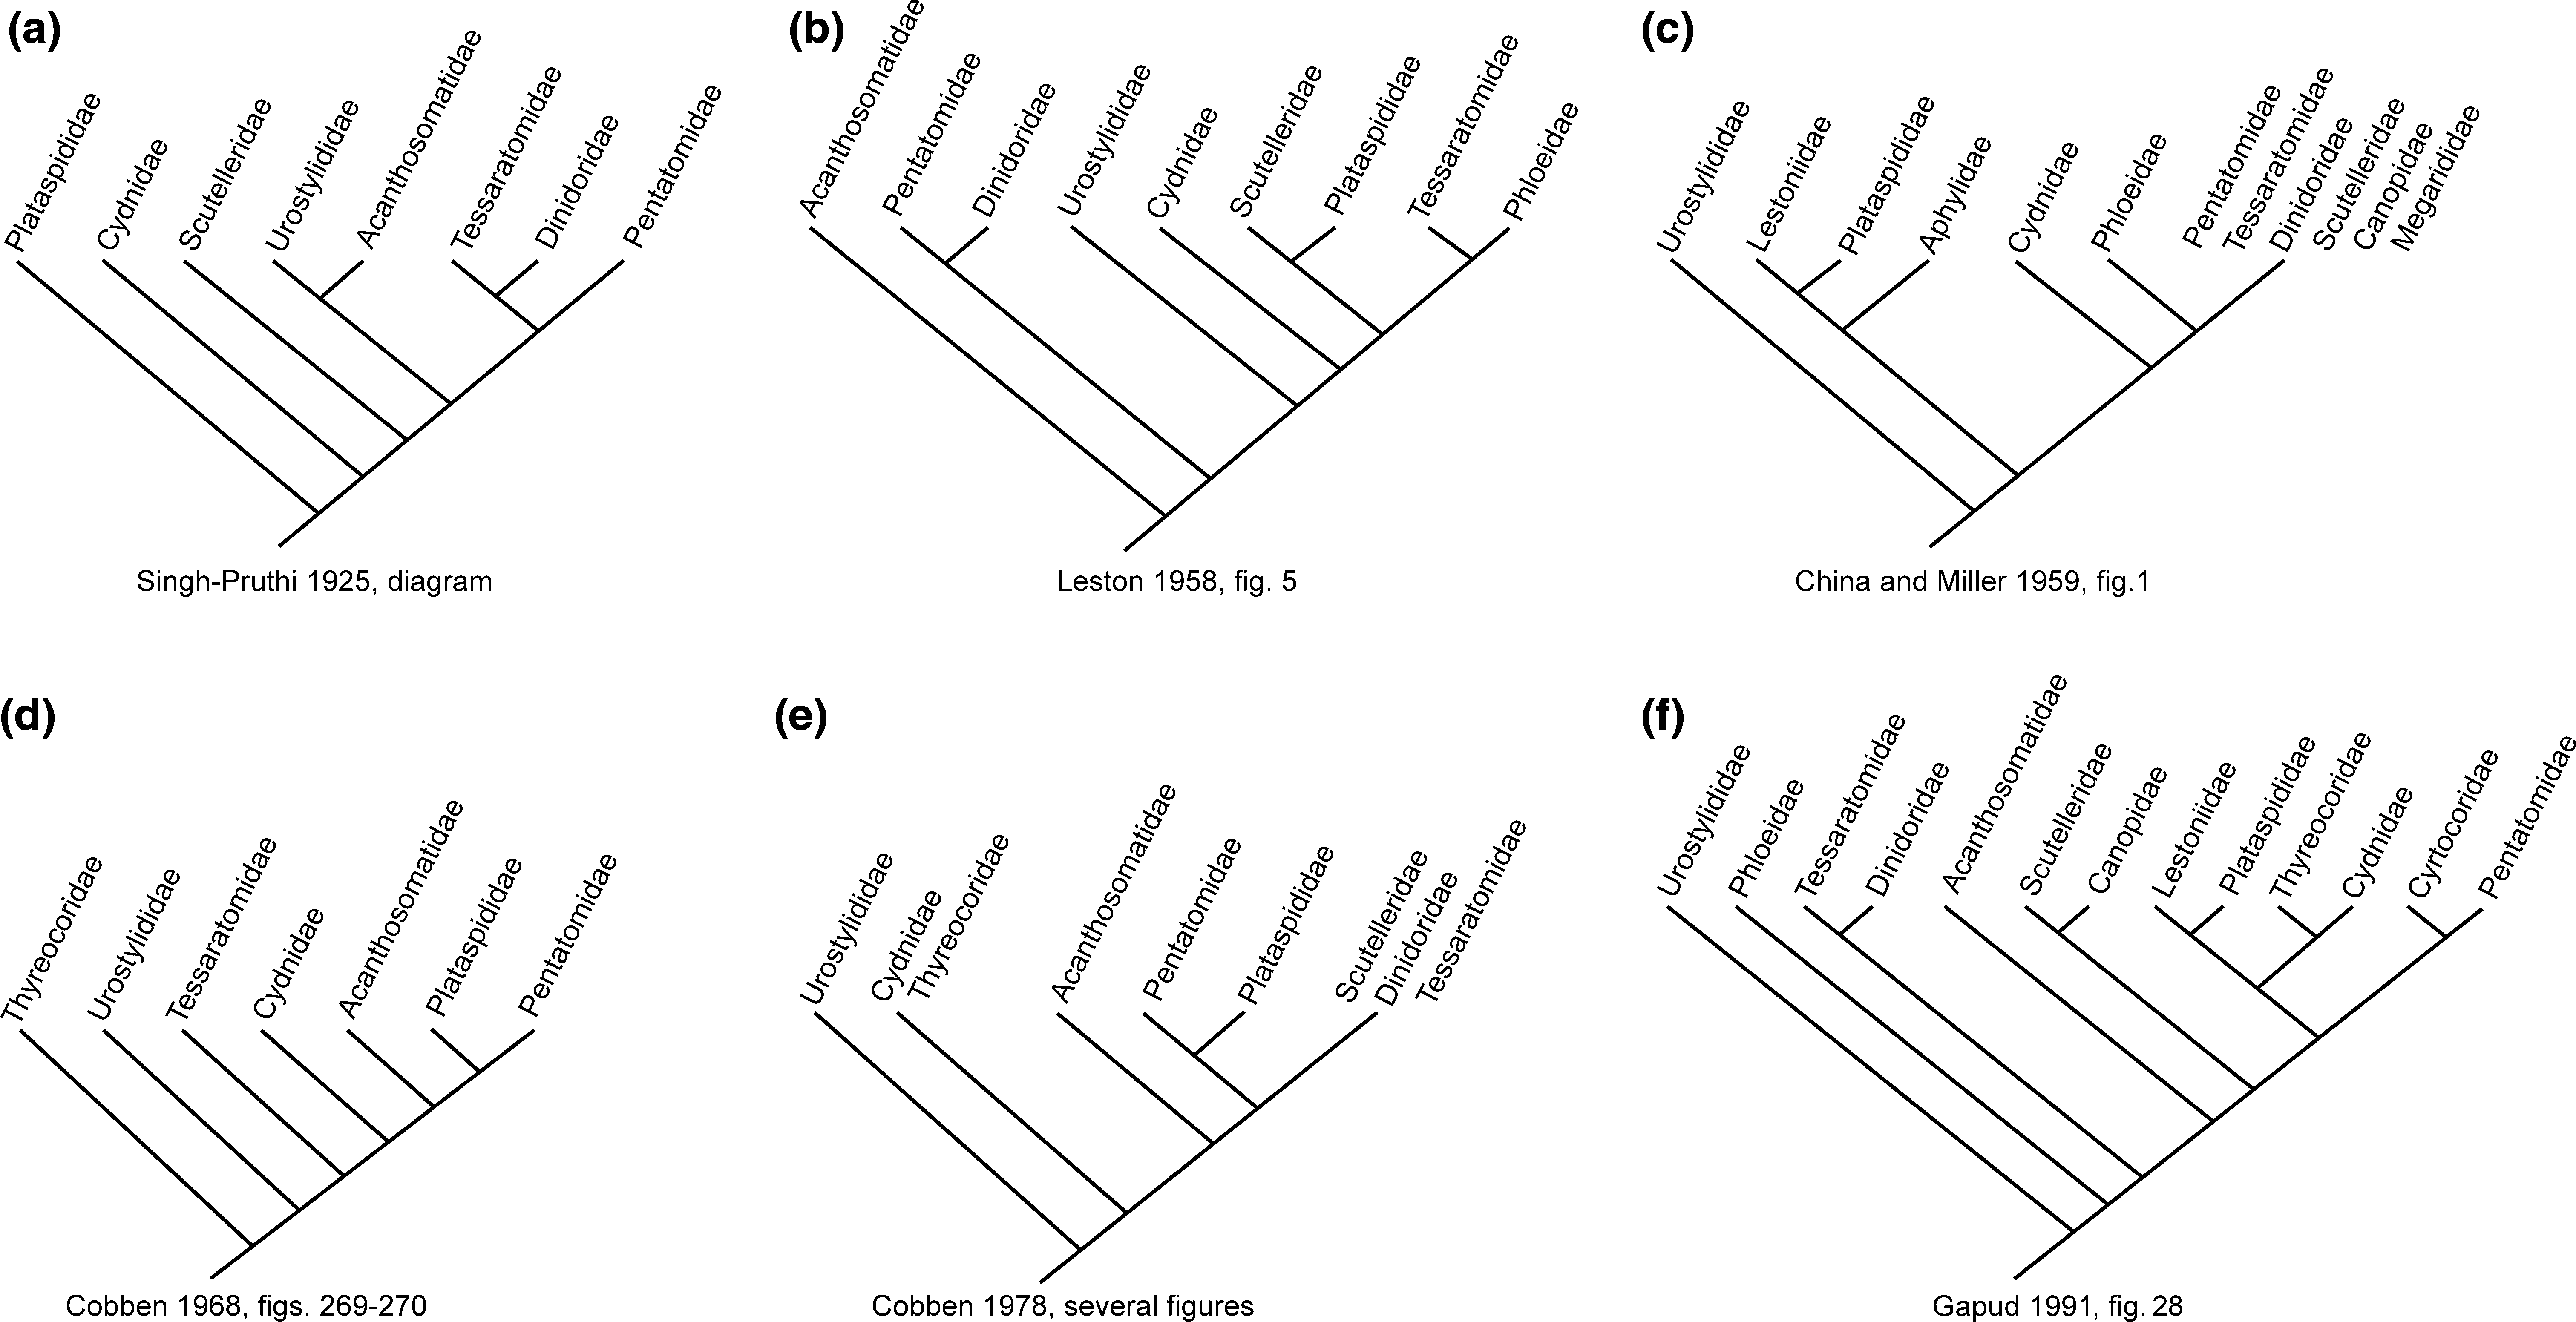
Pentatomidae . Leston (1952) raised it to family status (= Brachyplatidae). Most modern workers do not recognize an infrafamilial classification, with the exception of Rider (2006), who recognized the subfamilies Brachyplatidinae and Plataspidinae . Gapud (1991) considered Plataspididae as the sister group of the Lestoniidae ( Fig. 1f View Fig ), in spite of the variability of the characters that grouped them (see comments under Lestoniidae ). One character that was treated as
synapomorphic for the Pentatomoidea by Gapud (1991) was the presence of a pair of ring sclerites (chitinellipsen; Dupuis, 1955). Gapud treated a single ring sclerite as plesiomorphic because that is the
condition he found in the Coreidae that he examined. His observations indicated that these structures were absent in the Plataspididae , Acanthosomatidae , and Cyrtocorinae , a condition that he treated as a reversal. Our observations in part contradict those of Gapud (1991), as we found a pair of ring sclerites to be present in the species of Plataspididae and Acanthosomatidae that we examined, but in accordance with the observations of Gapud (1991) we did not observe ring sclerites in the Cyrtocorinae . Because the presence of ring sclerites varies greatly within families and subfamilies, we have not included this character in our morphological matrix.
Analytical result: The Plataspididae resembles, at least superficially, the Canopidae and Megarididae , and indeed groups with them in our morphological analyses on the basis of one or more of the following characters ( Figs 42–44 View Fig View Fig View Fig ): body sphaeroid ( 12), scutellum well developed ( 163), frena obsolete ( 182), and gonocoxites 9 joined by membrane ( 461). In the molecular and total evidence analyses, the position of the Plataspididae is more basal and always dissociated from the Canopidae , although not from the Megarididae ; here it forms the sister group (sometimes in conjunction with other taxa) of nearly all Pentatomoidea except Urostylididae and Saileriolidae . These results suggest that the enlarged scutellum is the result of convergence, a conclusion that can be drawn from its observed occurrence in many groups of pentatomoids which show little relation to one another on the basis of other characters. Although the relatively basal placement of the Plataspididae contradicts the theories of all prior authors ( Fig. 1 View Fig ), this position is not altered by changing the taxon composition or the cost regimes in the combined analyses ( Figs 51–55 View Figs 49–52. 49 View Fig View Fig View Fig ). The monophyly of the Plataspididae is supported in our analyses by the condition of laterotergites 9 being contiguous and partially or totally covering segment X ( 470).
No known copyright restrictions apply. See Agosti, D., Egloff, W., 2009. Taxonomic information exchange and copyright: the Plazi approach. BMC Research Notes 2009, 2:53 for further explanation.
|
Kingdom |
|
|
Phylum |
|
|
Class |
|
|
Order |
|
|
InfraOrder |
Cimicomorpha |
|
SuperFamily |
Pentatomoidea |
|
Family |


